Showing posts with label RAM Analysis. Show all posts

Friday, October 16, 2009

Walk-Through: Volatility Batch File Maker and Volatility's ProcDump

1. Download the following files from Hogfly (Website)
exemplar6.tar.gz.001
exemplar6.tar.gz.002
exemplar6.tar.gz.003

In my example I placed the files in e:\exemlar6\ directory

2. Add the downloaded files together and extract with the following cmd prompt code:

Copy /b “exemplar6.tar.gz.001”+ “exemplar6.tar.gz.002”+” exemplar6.tar.gz.003” exemplar6.tar.gz

3. Extract using WinRAR (exemplar6.tar.gz to exemplar6.vmem)

4. Run PtfinderFE against extracted file(exemplar6.vmem) which creates exemplar6.txt


5.Run Volatility Batch File Maker.
-a. Select e:\exemlar6\xemplar6.vmem with “Browse for Memory Capture”.
-b. Select e:\exemlar6\exemplar6.txt (created by PtFinderFE) for your memory image with “Browse for Offset Text File”.
-c. Create Batch (Which is hidden until the previous listed fields are populated).

6. .Goto the directory containing exemplar6.vmem (e:\exemlar6\) and run e:\exemlar6\procdump.bat file.

7.Browse the e:\exemlar6\procdump folder.


8.Use an anti-virus tool against the reconstructed executable files in the e:\exemlar6\procdump directory

I decided to send the files to Virus Total for testing. Using their "Send to" Function.

PID 464 - “dw8.exe”(Virus Total Results: 13 of 40 Hits)
PID 648 ”tdctxte.exe” (Virus Total Results: 116 of 41 Hits)
PID 872 ”atsxyzd.sys” (Virus Total Results: 117 of 41 Hits)
PID 1056 ”dxonool32.sys” (Virus Total Results: 119 of 40 Hits)
PID 1876 ”sopidkc.exe” (Virus Total Results: 14 of 41 Hits)
PID 1932 ”afisicx.exe” (Virus Total Results: 119 of 40 Hits)


Some Additional Notes and Some Background:
I'm not sure why but it seems the executables that have unique icons instead of the generic executable icons have a high percentage of being malicious.

Until I created Volatility Batch File Maker I was using batch file, and changing input via a spreadsheet and some “find and replace” functions. One of the batch file I created attempted to use ProcDump on all the PIDs (-p option) from 0 to 6000. Reconstructed executables were only made for PIDs that were listed as running by Ptfinder. I also tried using Procdump offset (-o option) function with the same results(and ALOT more time!!!).

I was analyzing a “real world” machine which was running over 90 processes. I placed the executables created by ProcDump into a zip files, by groups of 10. I then sent them up to Virus Total for Scanning. Unfortunately when I found a hit there was no way to determine which file out of the group of ten was the suspected malware file.

I would like to start an ssdeep database of common executables created by Procdump.

Volatility Batch File Maker


The Tool: VolatilityBatch File Maker Download

I wanted to take the text output of the various tools (Ptfinder, PtFinderFE and Volatility >PsScan2) which identifies all the offsets for (running) processes and input that offset data into several Volatility tools (ProcDump, MemDmp and VadDump). This program creates three batch files. After running the batch files I can quickly leverage additional investigation techniques at the output.

1.Run Ptfinder, PtFinderFE or Volatility >PsScan2 to create a text file that contains process offsets.
2.Run Volatility Batch File Maker.
-a.Select you memory image with “Browse for Memory Capture”.
-b.Select the Offset Text File for your memory image with “Browse for Offset Text File”.
-c.Create Batch (Which is hidden until the previous fields are populated)

Three Batch files are created,upon execution of the “Create Batch”, in the root folder where the memory capture resides. The three batch programs created are procdump.bat, memdmp.bat and vaddump.bat. When you run the batch files each one will create a folder in the residing directory and populate that directory with the selected Volatility Output. Each batch file also creates an additional text output showing any errors(procdumpinfo.txt, memdmpinfor.txt and vaddmpinfo.txt).

The following is an example of the procdump batch file with the following two inputs:
Location of Volatility = "C:\volatility"
Location of Memory Dump ="E:\exemplar\6\exemplar6.vmem"


mkdir procdump
cd procdump
python "c:\volatility\volatility" procdump -f "E:\exemplar\6\exemplar6.vmem" -u -o 0x00551b80>>procdumpinfo.txt
python "c:\volatility\volatility" procdump -f "E:\exemplar\6\exemplar6.vmem" -u -o 0x0166f7b0>>procdumpinfo.txt
python "c:\volatility\volatility" procdump -f "E:\exemplar\6\exemplar6.vmem" -u -o 0x01690920>>procdumpinfo.txt
python "c:\volatility\volatility" procdump -f "E:\exemplar\6\exemplar6.vmem" -u -o 0x016aa3c0>>procdumpinfo.txt
python "c:\volatility\volatili*****Truncated - You get the idea********************

Uses for the Ouput of the Batch Files:
After re-creating all the “executables” from the running processes you can run a virus scanner at the procdump folder. This can be another tool in the arsenal of defeating the Trojan Horse Defense.

Or how about one for the incident response guys... You could run this protocol at a full memory.dmp or on a converted hiberfil.sys (Converted with Suiche's Hibershell) created on a machine prior to your actual response and collection. How many times has someone “helped” you out by deleting the malware from the target machine just before you walked into the door. If the memory.dmp or hiberfil.sys is recent you might be able to “recreate” the malware executable. You could also show a machine has been compromised (or not) when the memory.dmp or hiberfil.sys was captured

The Vaddump folder now contains the output which can easily be used in a program like Encase to give you context to you memory image.

Some walk-through examples to be posted soon. Also I am in the process of updating PtFinderFE!!!

Saturday, February 21, 2009

VMWare Running? Better Check for Different Windows Operating System's EPROCESS Blocks

Identify Multiple Windows OS Versions in a Single RAM Capture if the Host Machine is Running VMWare Machines.

I often run VMWare Machines, on my host machine,so I can easily grab the machine's RAM contents by suspending the machine and analyzing the VMEM file. Nothing new there. But what is cool is when you run several VMWare machines (or just one) and grab the RAM of the host machine. If you use other tools to determine which OS is running they will only identify what OS is running on the “Host” machine and not what OS(s) are being running on VMWare machines.

So to find out which different Windows OSs were running in your captured RAM use the following GREP search across your RAM acquisition
\x4E\x00\x54\x00\x20\x00\x4B\x00\x65\x00\x72\x00\x6E\x00\x65\x00\x6C\x00\x20\x00\x26\x00\x20\x00\x53\x00\x79\x00\x73\x00\x74\x00\x65\x00\x6D\x00\x00\x00\x00\x00[\x00-\xFF]\x00[\x00-\xFF]\x00\x01\x00\x46\x00\x69\x00\x6C\x00\x65\x00\x56\x00\x65\x00\x72\x00\x73\x00\x69\x00\x6F\x00\x6E\x00\x00\x00\x00\x00

The GREP expression loosely translates to,
“N.T. .K.e.r.n.e.l. .&. .S.y.s.t.e.m........... F.i.l.e.V.e.r.s.i.o.n.....”.

This is the same GREP Expression in the RAM Enscript I created. (In the enscript the” \” is “\\”). The GREP expression is the magic number needed to find the metadata contained in the NTOSKRNL.exe. The following bytes after this GREP is the Windows OS File Version Number The file version can then be converted to the Specific Windows OS. The following is an example from the RAM Acquistion with the HOST OS (WinXPSP2) and Two VMWARE Machines (Vista and Win200) ________________________________________
Comment Operating System: Windows XPSP2 Internal Version Number = 5.1.2
File Offset 7209948
N·T· ·K·e·r·n·e·l· ·&· ·S·y·s·t·e·m·····r·)···F·i·l·e·V·e·r·s·i·o·n·····
________________________________________
Comment Operating System: Windows Vista Internal Version Number = 6.0.6
File Offset 445911836
N·T· ·K·e·r·n·e·l· ·&· ·S·y·s·t·e·m·····n·'···F·i·l·e·V·e·r·s·i·o·n·····
________________________________________
Comment Operating System: Windows 2000 Internal Version Number = 5.00.
File Offset 712069132
N·T· ·K·e·r·n·e·l· ·&· ·S·y·s·t·e·m·····8·····F·i·l·e·V·e·r·s·i·o·n·····
________________________________________

During my testing I also shutdown the VMWare Machines for approximately 10 minutes and re-acquired the RAM. I still found the OS Metadata, of one of the Machines in the second RAM acquisition. Showing there is some persistence of VMWARE' Machine's RAM in the HOST Memory. (No additional programs were started by the user during the ten minute waiting period-except the RAM acquisition tool).

Once you have the different OSs inside your RAM you can also use the same RAM Enscript to find the running/exited processes (EPROCESS Blocks) of each OS along with the other remnants. The Second RAM Acquisition did not contain the OS Metadata for the Vista VM but I still found 20 unique Vista EPROCESS Blocks. I also found about 7 unique EPROCESS Blocks from he Win2000 VM. Showing a little persistence in the RAM

So yeah... this is cool in the lab... but not sure how often anyone will need this information in the “Real World”.

Thanks to Eric at Digital Intelligence for idea of checking for this...

Wednesday, January 28, 2009

Using Volatility (1.3_Beta), Volatility Plugin from Moyix, a test RAM Image (xp-laptop-2005-06-25.img) and a Windows Hash/Password Finder (SamInside or Cain and Abel) identify the passwords for the following users: Sarah, phoenix and the Administrator.

1. Run hivescan to get hive offsets

command: python volatility hivescan -f "C:\Dump\xp-laptop-2005-06-25.img"

Offset (hex)
42168328 0x2837008
42195808 0x283db60
47592824 0x2d63578
207677272 0xc60e758
207736840 0xc61d008
207759192 0xc622758
207822 ***** Truncated to save some space

2.Run hivelist with the first hivescan offset


command: python volatility hivelist -f "C:\Dump\xp-laptop-2005-06-25.img" -o 0x2837008

Address Name
0xe1ecd008 \Documents and Settings\Sarah\Local Settings\Application Data\Microsoft\Windows\UsrClass.dat
0xe1eff758 \Documents and Settings\Sarah\NTUSER.DAT
0xe1bf9008 \Documents and Settings\LocalService\Local Settings\Application Data\Microsoft\Windows\UsrClass.dat
0xe1c26850 \Documents and Settings\LocalService\NTUSER.DAT
0xe1bf1b60 \Documents and Settings\NetworkService\Local Settings\Application Data\Microsoft\Windows\UsrClass.dat
0xe1c2a758 \Documents and Settings\NetworkService\NTUSER.DAT
0xe1982008 \WINDOWS\system32\config\software
0xe197f758 \WINDOWS\system32\config\default
0xe1986008 \WINDOWS\system32\config\SAM
0xe197a758 \WINDOWS\system32\config\SECURITY
0xe1558578 [no name]
0xe1035b60 \WINDOWS\system32\config\system
0xe102e008 [no name]

3. Find Password Hash (-y System Hive Offset)(-s SAM Hive Offset) and Send to Text File.

Command: volatility hashdump -f "C:\Dump\xp-laptop-2005-06-25.img" -y 0xe1035b60 -s 0xe1986008>Password_Hash.txt

Administrator:500:08f3a52bdd35f179c81667e9d738c5d9:ed88cccbc08d1c18bcded317112555f4:::
Guest:501:aad3b435b51404eeaad3b435b51404ee:31d6cfe0d16ae931b73c59d7e0c089c0:::
HelpAssistant:1000:ddd4c9c883a8ecb2078f88d729ba2e67:e78d693bc40f92a534197dc1d3a6d34f:::
SUPPORT_388945a0:1002:aad3b435b51404eeaad3b435b51404ee:8bfd47482583168a0ae5ab020e1186a9:::
phoenix:1003:07b8418e83fad948aad3b435b51404ee:53905140b80b6d8cbe1ab5953f7c1c51:::
ASPNET:1004:2b5f618079400df84f9346ce3e830467:aef73a8bb65a0f01d9470fadc55a411c:::
Sarah:1006:aad3b435b51404eeaad3b435b51404ee:31d6cfe0d16ae931b73c59d7e0c089c0:::


4.Import Password_Hash.txt into a Password Finder (SamInside, Cain and Abel...).

User: Sarah Password: Empty
User: phoenix Password: Neon96
User: Administrator Password: Neon1996

Thursday, June 5, 2008

Winen.exe - RAM Imaging Tool Included in New Version of Encase

Today when I downloaded the latest version of Encase (6.11.0.43) I discovered winen.exe in the Encase Program Folder. Apparently winen.exe is the new RAM Acquisition Tool Provided by Guidance. Winen.exe is suppose to work on all variations of Windows higher then 2000.

A search of Guidance Support Portal and I was able to down Winen.pdf. (Guidance Forum Access Required - 3 pages).

The Winen Executable can run as a command line tool, user prompt or from a configuration file. You can run Winen.exe from a USB drive that you plug into the Target Machine. You do need Local Administrator Privilege (which can be difficult to get- sometimes!).

If you can run Winen.exe from a USB Drive and it will prompt you for the required information needed to create the image file.

If you set up a configuration (Config) file you can speed things up.

Setting Up a Configuration File.
I created the following Config File:


As you can see I really placed the name of the image(Evidence Name)in the Evidence Path. In the Evidence Name Path I also put in the Evidence Name. This is so when I run the program it will automatically save my image file to the USB Device I am running it from.

In my example I will create a RAM_ACQ.e01 file in the same directory as I have Winen.exe installed on.

Batch File
I then created a batch file with the following line:
winen -f winen.config

“winen” is the executable to run
“-f” is the option for a Config File
“winen.config” is the name of my Config File (Must be in same path as Winen.exe)

Run the Batch file from your USB and you will automatically save you image file to your USB Drive.

Final Tweak
You can also change the name of winen.exe to something benign sounding (e.g. “sys32.exe”) to make it more difficult to identify by your target.

Using your RAM Acquisition e01 File.
Once the RAM image is created you can get information out of it by Using my RAM Enscript.

You can also use PtfinderFE on the RAM Image but you have to strip the embedded e01 data from your image file. My favorite way is by opening the image up in FTK Imager and export the unallocated space out. You could do the same thing in Encase.


FootPrint

Winen.exe will use approximately 2.8 Mb of RAM which might also be found in the PageFile.

The following keys will be created or altered:

HKEY_LOCAL_MACHINE\SYSTEM\ \Enum\Root\ LEGACY_WINEN_
HKEY_LOCAL_MACHINE\SYSTEM\ \Services\ winen_
(Acording to the Winen.pdf)

Changes regarding adding a USB would also apply (e.g. USBStor in the Registry).

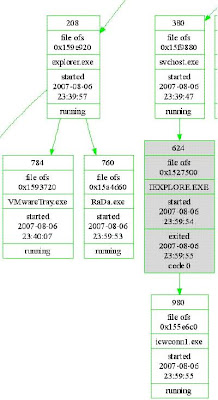
The batch file(cmd.exe) and Winen.exe (in the picture) as they appear in a PtfinderFE Graphic.

KntTools is still my RAM Acquisition tool of choice.

Monday, May 19, 2008


I am presenting a two-day course on RAM Acquisition and RAM Analysis at Digital Intelligence. The course is June 10-12, 2008 and is FREE.

The following is a quick synopsis of the training:

RAM Analysis – Vista and Beyond
Everything run on a computer passes through the RAM at one time or another. The trick is being able to identify data found in a RAM capture and relate it back to the item that originally created it. This two day training session includes a very "hands-on" lab to train on different tools and using various methods for collecting RAM from a running machine.

For more Information.

Saturday, May 3, 2008

BIOS Magic Numbers in RAM (Beta)

A colleague of mine approached me after teaching a class on finding information in RAM. He asked me to prove a particular RAM acquisition came form a particular machine. My first thought was to run to the remnants from the registry. But do to paging of the registry and many false positives this proved a little more difficult then I originally thought... But as you guessed by the title I then found the information from the machine’s BIOS.

1. Using Encase create the following GREP Expression:

\x00\x14\x00\x00\x01\x02..\x03

2. Run against the DFRWS Dump and review your findings:

The information contained in the BIOS is pretty substantial often including make, model and serial number of the computer the data was collected

So far the BIOS Magic Numbers have found the BIOS Information on every RAM Acquisition I have tested it on. (Win2000 to Vista).

Future Work:
1. Find the Length of the BIOS Information or a Good Footer.
2. Place in RAM Enscript

Friday, May 2, 2008

RAM Enscript Version 1.0

RAM ENSCRIPT UPDATED!!! Download

The new RAM Enscript contains:
OS Identification
Processes (Exited / Running)
Registry Remnants (UserAssist)
MSHTML Remnants
MFT Parser.

Runs against RAM Dumps from Windows 2000 to Vista.

Many Thanks to the First RAM Analysis Advance Class at IACIS- Thanks for the Hard Work.

Saturday, March 15, 2008

Practical of “15 Minute Virus Analysis”

I want to show a practical of my “15 Minute Virus Analysis”

You must download the RADA Virus if you want to “play” along. The RADA Virus is a REAL VIRUS SO BE CAREFUL…

The RADA VIRUS was created several years ago to test other geeks participating in the HONEYNET Project. Also download one of the best solutions to the RADA Challenge (But don’t read the solution, yet…).

Make three folders in you working directory called: Baseline, Infected and Start_and_Stop. Start your machine (After you clone your pristine VMWARE Win2000 Machine). When you machine completely boots suspend your machine. Another term often used for suspend is “pause” because the VMWARE “Suspend” Button looks just like a regular “Pause” button. . Copy the VMEM file from you VM Directory into your working directory titled” Baseline”.

In my example I am copying the VMEM file from my VMWARE Machine Called Win2000-Rada.VMEM to the working “Baseline” Folder.

Now Resume the machine and add the RADA Virus. I choose to originally copy the virus to a CD so I place the CD in the machine and copy RADA to a Folder called "Virus" on my Desktop.

Now double click on RADA. Wait a second and “Suspend” the machine.

If you did not run the Connection Wizard prior to infection you will probably see the following:


Copy the VMEM file to you “Infected” Folder. Resume your machine. Using your machine’s own functions restart the machine. Once the machine reboots suspend the machine again and copy the VMEM file to the Stop_and_Start Folder.

So now we have 3 VMEM files copied into our three working folders.

Run PTFinder or PTFinderFE against the “baseline” VMEM and review the chart.

Now run PTFinder or PTFinderFE against the “Infected” VMEM and review you chart. You should see something like the following:

In our example the Offset of RADA= 0x15a4d60

To make my life easier I just copy cmd.exe, lspm.exe and p2x588.dll (needed by lspm.exe to run) into my “Infected” working directory. Run cmd.exe which opens to your working folder and type the following:

lspm Win2000-Rada 0x15a4d60 (and Enter)

Rada.dmp is created and put in the “Infected” Working Folder. Rada.dmp is a copy of the RADA.Exe Program as copied out of volatile memory.

Open Rada.dmp with AnalogX’s TextScan and look for important information. The following is a truncated sample of the text taken from my exam.


72457 Unichar 42 http://10.10.10.10/RaDa/RaDa_commands.html
75214 Unichar 20 C:\RaDa\bin\RaDa.exe
95754 Unichar 42 http://10.10.10.10/RaDa/RaDa_commands.html
102470 Unichar 55 HKLM\Software\Microsoft\Windows\CurrentVersion\Run\RaDa
103114 Unichar 27 C:\WINNT\System32\wshom.ocx
105509 Unichar 49 C:\Program Files\Internet Explorer\iexplore.exe
112221 Unichar 29 pec=C:\WINNT\system32\cmd.exe
122742 Unichar 42 http://10.10.10.10/RaDa/RaDa_commands.html
188853 Char 40 !This program is the binary of SotM 32..
197922 Unichar 23 http://10.10.10.10/RaDa
197974 Unichar 18 RaDa_commands.html
198038 Unichar 12 download.cgi
198070 Unichar 10 upload.cgi
198098 Unichar 11 C:\RaDa\tmp
198150 Unichar 51 HKLM\Software\Microsoft\Windows\CurrentVersion\Run\
198294 Unichar 11 C:\RaDa\bin
198346 Unichar 51 HKLM\Software\VMware Inc.\VMware Tools\InstallPath
198454 Unichar 36 Starting DDoS Smurf remote attack...
198611 Char 15 Command_install
198643 Char 53 You can learn a lot playing funny security challenges
198747 Char 13 Command_usage
198763 Char 12 Command_exit
198779 Char 12 Command_conf
198835 Char 10 Command_go
198847 Char 17 Command_uninstall
199577 Unichar 15 http://192.168.
199613 Unichar 14 http://172.16.
199649 Unichar 10 http://10.
199685 Unichar 28 InternetExplorer.Application
199813 Unichar 11 about:blank
199985 Unichar 10 screenshot
200026 Unichar 11 Application
200096 Unichar 44 Scan Of The Month 32 (SotM) - September 2004
200240 Unichar 40 http://www.honeynet.org/scans/index.html
200328 Unichar 43 Copyright (C) 2004 Raul Siles & David Perez
200420 Unichar 25 RaDa Usage
200885 Unichar 41 RaDa Current Configuration
201145 Unichar 38 "Content-Disposition: form-data; name="""
201257 Unichar 11 Submit Form
201297 Unichar 44 Content-Type: multipart/form-data; boundary=
201442 Unichar 18 application/upload
201486 Unichar 15 ADODB.Recordset
201634 Unichar 47 "Content-Disposition: form-data; name=""{field}"";"
201734 Unichar 18 " filename=""{file}"""
201778 Unichar 18 Content-Type: {ct}
202062 Unichar 50 Copyright (C) 2001 Antonin Foller PSTRUH Software
203147 Unichar 39 Authors: Raul Siles & David Perez 2004


Wow there is a lot of information in the little DMP File. Now go look at the Solution you downloaded. Our 15 minutes of research is not too shabby.

Friday, February 29, 2008

Fifteen Minute Malaware Analysis

Tools:
1. VMWARE Workstation or VMWARE Server (Sever=free)
2. Windows 2000 (Small$)
3. TextScan - Free (by AnalogX)
http://www.analogx.com/contents/download/program/textscan.htm
4. PtfinderFE - Free (PTFINDER by Andreas Schuster and Front-End by Richard McQuown)
5. LSPM (SourceForge)- Free (by Harlan Carvey)

Steps:
1. Create a VMWARE Windows 2000 Machine. Keep the RAM 256 MB or less (Saves Processing Time).
2. Start VMWARE 2000 Machine. Pause the machine.
3. Place a copy of the .VMEM file into a folder called "Baseline".
4. Restart your machine and add your virus. I like to run the virus from the desktop.
5. Pause your machine and place your .VMEM file into a new folder called "Infected".
6. Restart your machine. Now recycle your machine power(Turn it off and back on).
Pause your machine again and place your last .VMEM file into a folder called "Stop_and_Start".
7. Now point PTFINDERFE at the three .VMEM Files in the "Baseline", Infected" and "Stop_and_Start" Folders.
8. Review the Output JPEG image. and find your virus Process PED. Get the PED(0x#########).
9. Run LSPM using PED from Step 8.
10. Run TextScan at the LSPM created Image file.
11. Review the TextScan Text and find your gold.

Friday, February 22, 2008

“Lest We Remember: Cold Boot Attacks on Encryption Keys"

Seems like a team of Princeton students have put together a very well done website, research paper (pdf) and video regarding acquiring RAM. The jist of these items shows: Information stays in RAM after power loss and then degrades, cooling DRAM Chips will help prevent the decay of volatile memory and keys to Full Disk Encryption can be obtained by capturing RAM.

The online community has definitely weighed in:
Slashdot Replies: Over 300 Comments
Freedom-to-tinker.com Over 121 Comments
I even received an email message from Multimedia Forensics regarding this new information.

I think my prior blogpost regarding the “Guillotine Method” of RAM Acquisition is the perfect twin to their basic premises except the Guillotine Method is really a “HOT Boot”.

SO at least I can say, “…I remembered... RAM Capture can be Valuable to Forensic Examiners””

Wednesday, January 23, 2008

Speaking Engagement


I am presenting a two-day course on RAM Acquisition and RAM Analysis at the International Association of Computer Investigative Specialists (IACIS) 2008 CFCE Course between April 28, 2008 through May 9, 2008 in Orlando, Florida.

My sponsor is Digital Intelligence.


The following is a quick synopsis of the training:

RAM Analysis – Vista and Beyond
Everything run on a computer passes through the RAM at one time or another. The trick is being able to identify data found in a RAM capture and relate it back to the item that originally created it. This two day training session includes a very "hands-on" lab to train on different tools and using various methods for collecting RAM from a running machine.

For more information go to the IACIS Website

Thursday, November 22, 2007

RAM Enscript


What will this ENSCRIPT find in a RAM Dump File?

1. Running and Exited Process Information
2. Operations System Information
3. USER ASSIST Remnants

See Output: OS Version Processes User Assist

BACKGROUND:

When I originally started I wanted to be able to search a RAM Dump file and find some of the important stuff like the EPROCESS Headers. I then wanted the OS information from the dump files I also wanted to use just one tool.

So this Enscript was redesigned from the guts of the Encase Example “File Finder Enscript”. Basically I took out most of what I didn’t need and added some complex magic numbers and specific decoding for the hits. Please see the CAUTIONS prior to copying and using this Enscript.

I could not have made this Enscript with out the prior work and help of Andreas Schuster and Harlan Carvey.

To affectively run the Enscript follow these steps:

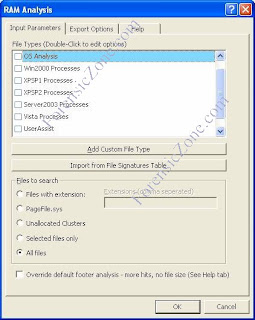
1. Run Enscript and check box the “OS Version“ with the Bookmark Folder Name of ”OS Version”.
2. To find the Processes - Check the OS Version found in step #1 and re-run the Enscript choosing the correct OS(For Example “Vista Processes” to Find Vista Processes) and put in “Processes” Bookmark Folder
3. For USER Assist Remnants run the Enscript a third time checking “User Assist” to the User Assist Bookmark
4. Review your findings. Use the REPORT view for the “Best Look”.

You can check more then one item and the Enscript still runs properly but all of your information will be bookmarked into the same folder

Friday, November 2, 2007

RAM Enscript Download

Download RAM Enscript (SourceForge)

Concerns---Bugs---Caution

Concerns

1. Enscript is in BETA and still evolving!
2. VISTA Process Search String might not collect all processes (still researching to find out what is missed. An estimate of how many are found- probably 90-95% Solution AS IS.)

Known Bug

1. Microsoft Windows XP 2003 Edition is SP1 (Version 5.2600) reports as XPSP2 so check your findings

Caution- Caution-Caution-Caution-

Be Careful Not to Overwrite Your Default Enscripts --- the Best Plan is to Copy Your Enscripts Prior to Using the Ram Analysis Enscript and to run this Enscript form another location (like CD-ROM Drive )

This Script Does Not Play Well with Other Enscripts Because I have Modified Some of the Common Files………………You Are Warned……….

Friday, October 26, 2007

PTFinderFE Output

PTFinderFE Facts

Who Created PTFinder ?
Andreas Schuster http://computer.forensikblog.de/en/2006/

Who Created the OS Detection Script ?
Harlan Carvey http://windowsir.blogspot.com/

What does PTFinder Do ?
PTFinder searches a memory dump of a system running Microsoft Windows for traces of processes and threads. Some functional checks are also applied. (According to Andreas Schuster)
Andreas Schuster http://computer.forensikblog.de/en/2006/

What Memory Dumps are Supported ?
DD dumps for example dd bs=4096 if=\\.\Device\Physicalmemory of=dumpfile
By pausing a VMWARE Session and using the VMSS File
In-Vivo using Sysinternal's LiveKD and a debugger
Post-Mortem as described in Microsoft Knowledge Base Article no.244139

What Operating Systems Memory Dumps are Supported ?
Windows 2000, Windows XP SP1, Windows XP SP2 and Windows 2003

Why do I need other Programs to make PTFinder to Work ?
PTFinder is written in Perl Script– so you need a Perl complier.
PTFinder creates a DOT file which can be used to create a graphic of the output.
See the DETAILED INSTRUCTIONS for more information.

Where can I get a Good Test Dump File?
http://www.dfrws.org/2005/challenge/index.html

Why did you Created PTFinderFE?
Well...I was placing the dump file into the PTFinder.PL Path which could have been eliminated by typing in the directory location of the dump file for every dump file I wanted examine( c:\case 05-022\Live Acq\234566-1). A DOT File was created which you have to copy into the Grapvhiz Executable folder, type in the command line and then copy all your outputs to my forensic directory. On top of all that if you used the "Program Files" Directory the command lines needed quotes(""). Since I use PTFinder a lot I had to make it more user friendly for me.

What is PTFinderFE?
A Microsoft Visual Basic Program that creates a batch file to do your leg work between PTFinder, Graphviz and your working forensic folder.

Why is PTFinder so Important?
Live Acquisition is the current trend in computer forensics. A lot of forensic investigators are doing live acquisitions but had nothing to effectively examine the output. Thanks to Andreas Schuster we have one more tool in the toolbox.
Back to Top